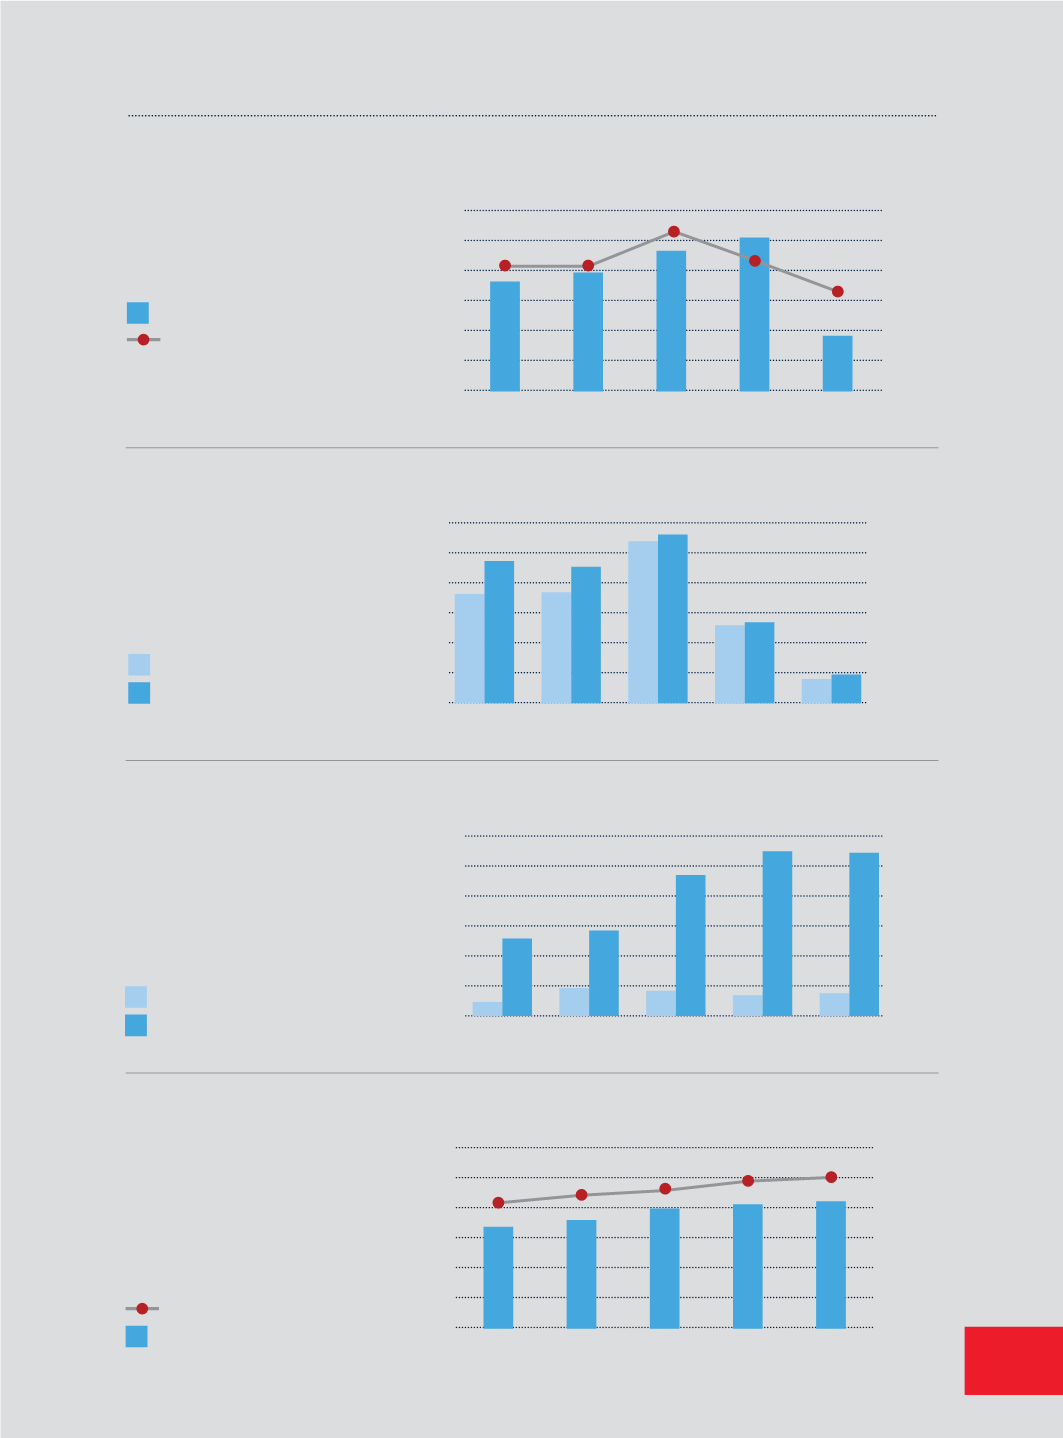
PERFORMANCE
Revenue vs EBITDA
Basic Earnings
Per Share vs Return
on Equity
Revenue
Earnings before
interests, tax,
depreciation and
amortisation
Basic earnings per share
Return on equity
$’000
600,000
500,000
400,000
300,000
200,000
100,000
0
$’000
120,000
100,000
80,000
60,000
40,000
20,000
0
FY2011
FY2012
FY2013
FY2014
FY2015
cents
12.0
10.0
8.0
6.0
4.0
2.0
0
%
12.00
10.00
8.00
6.00
4.00
2.00
0
FY2011
FY2012
FY2013
FY2014
FY2015
$’000
600,000
500,000
400,000
300,000
200,000
100,000
0
FY2011
FY2012
FY2013
FY2014
FY2015
cents
120.00
100.00
80.00
60.00
40.00
20.00
0
$’000
600,000
500,000
400,000
300,000
200,000
100,000
0
FY2011
FY2012
FY2013
FY2014
FY2015
Cash and Bank
Balances vs
Total Debts
Net Assets Per Share
vs Shareholders’
Funds
Cash and bank balances
Total debts
Net assets per share
Shareholders’ funds
ASL Marine Holdings Ltd. /Annual Report 2015
9


