Investor Relations ASL Marine Holdings Ltd

 Financials
Full Year Results Financial Statement And Related Announcement
Financials Archive![]() Note: Files are in Adobe (PDF) format.
Note: Files are in Adobe (PDF) format.
Please download the free Adobe Acrobat Reader to view these documents.
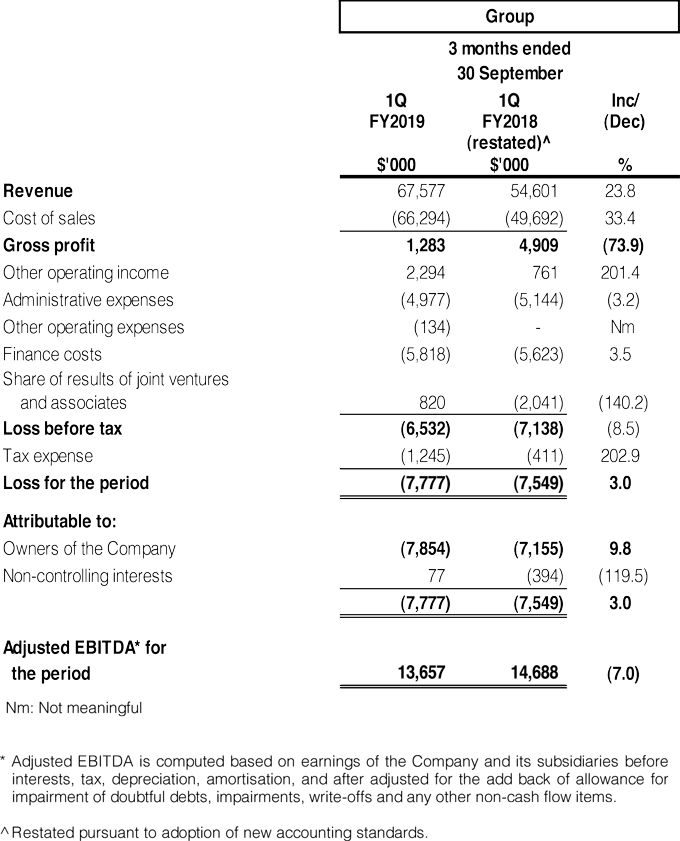
Income Statement
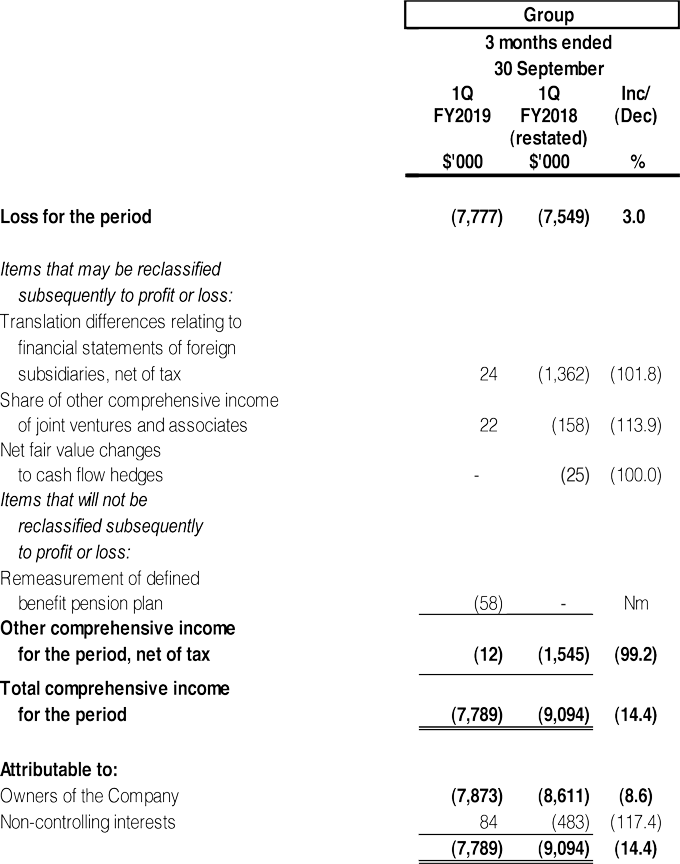
Statement of Comprehensive Income
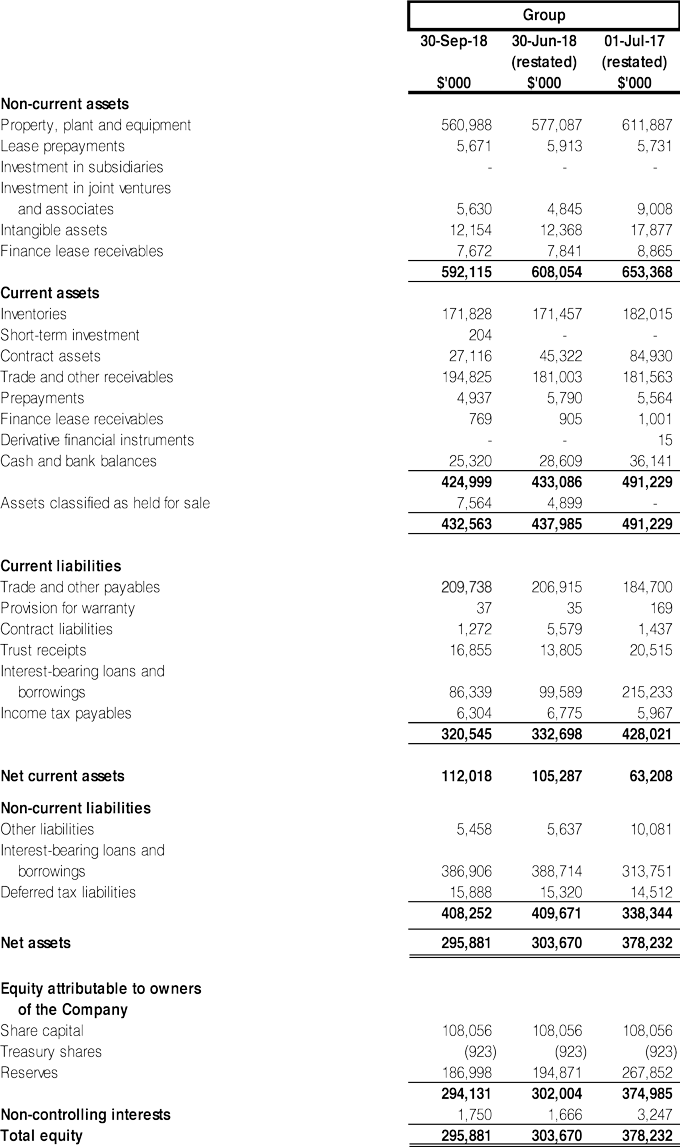
Balance Sheet
Review Of Group Performance
With the adoption of SFRS(I) 15 Revenue from Contracts with Customers, revenue and related costs of shipbuilding contracts with non-enforceability of right to payment for performance completed to-date are recognised only when the constructed vessels are delivered to customers at a point in time ("Completion Method"), instead of using the percentage of completion method ("POC"). As such, there will also be a mixture of contract with revenue recognised based on the Completion Method and POC depending on the terms of the contract. Given this, the results can be lumpy.
Revenue
Group revenue of $67.6 million for the 3 months ended 30 September 2018 ("1Q FY2019") was $13.0 million (23.8%) higher compared to the corresponding period in FY2018 ("1Q FY2018").
Details for revenue generated from each segment are as follows:

Shipbuilding
The breakdown of shipbuilding revenue generated and the number of units recognised are as follows:

Shipbuilding revenue in 1Q FY2019 decreased by $1.6 million (16.7%) compared to 1Q FY2018 mainly due to lower progressive revenue recognition from Tugs which are of lower contractual value, partially offset by higher revenue from delivery of three barges recognised based on the Completion Method.
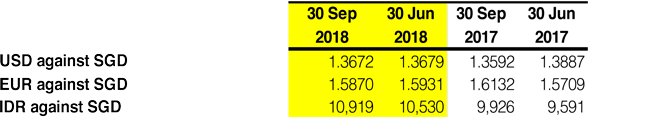
Excluding the effects of adopting SFRS(I) 15, revenue would be lower by $5.8 million (31.9%) due to lower progressive revenue recognition from 3 barges with minimum POC upon project completion. In addition, there was a reduction of revenue as a result of weakening of IDR against SGD on an IDR denominated contract.
Shiprepair and conversion
Recognition of shiprepair and conversion revenue is calculated based on project value multiplied by POC. Prior to adoption of the SFRS(I) 15, shiprepair projects are mainly short term in nature, resulting in revenue recognised only upon completion.
The breakdown of revenue generated from the shiprepair and conversion segment are as follows:

Shiprepair and conversion revenue increased by $7.3 million (44.5%) to $23.6 million in 1Q FY2019 partly due to more shiprepair jobs being recognised under POC in 1Q FY2019. There was a reduction in the restated revenue of 1QFY2018 by $9.2 million as a result of the adoption of SFRS(I)15, as one of the high value conversion jobs was recognised with minimum POC instead of being recognised in full upon completion.
Excluding the effects of adopting SFRS(I) 15, total revenue would be lower by $0.7 million (2.4%).
Shipchartering
The breakdown of revenue generated from the shipchartering segment are as follows:
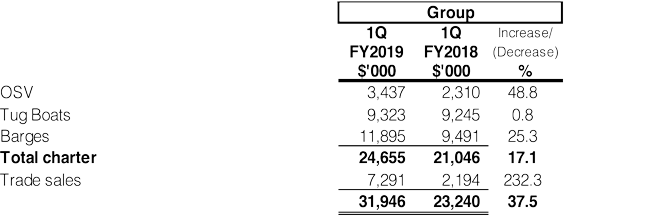
Shipchartering revenue increased by $3.6 million (17.1%) to $24.6 million in 1QFY2019 mainly due to
- Higher utilisation rate of OSV at 67% (1Q FY2018: 47%);
- Higher utilisation rate of towing tugs at 68% (1Q FY2018: 62%)
- Higher contribution from Grab Dredgers by $1.7 million (classified under Barges). Utilisation rate of Grab Dredgers increased from 16% in 1Q FY2018 to 27% in 1Q FY2019; partially offset by
- Reduced contribution from landing crafts (classified under Tug Boats) due to lower charter rates and fewer precast shipments; coupled with absence of charter income from two units of landing craft (one was off-hire from 4Q FY2018 and one was disposed in July 2018).
Trade sales comprised mainly of bunker sales, agency fee and ad-hoc services rendered. The increase in 1Q FY2019 was mainly due to more ad hoc services.
Engineering
The breakdown by revenue generated from the engineering segment are as follows:

Engineering revenue increased marginally in 1Q FY2019 mainly due to more orders for spare parts, partially offset by fewer orders for cutting/coupling systems.
Gross profit and gross profit margin
The breakdown of gross profit and gross profit margin for each respective segment are as follows:
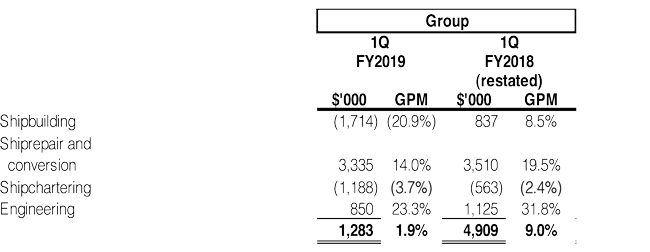
Shipbuilding
The Group recorded gross loss of $1.7 million in 1Q FY2019 mainly attributed to cost overruns and additional liquidated damage taken up due to delay in delivery of a project which is due for completion in next quarter, partially offset by profit derived from delivery of 3 barges.
Excluding the effects of adopting SFRS(I)15, gross loss would be $1.5 million in 1QFY2019 attributed to the cost overruns and additional provision of liquidated damage of a project.
Shiprepair and conversion
Despite increase in revenue, gross profit decreased by $0.2 million (5%) to $3.3 million with a lower gross profit margin of 14.0% mainly due to competitive market pricing and the need for higher manpower overheads being allocated to the ship repair segment.
Excluding the effects of adopting SFRS(I)15, gross profit would decrease by $0.9m (25.6%).
Shipchartering
The breakdown of gross profit and gross profit margin from shipchartering segment are as follows:
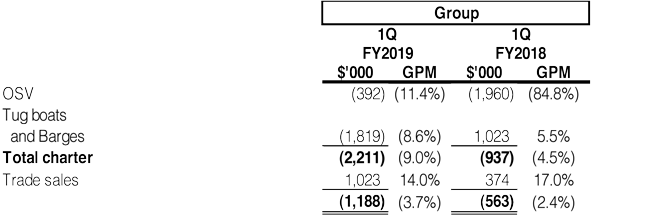
Gross loss and gross loss margin was higher in 1Q FY2019 as compared to the corresponding quarter, this was mainly due to:
- Lower utilisation and reduced charter rates from landing crafts;
- More vessels were under preparation for deployment in several infrastructure projects which is expected to be deployed progressively in 2Q FY2019;
- Increase in fuel price (1Q FY2019: $0.82/litre; 1Q FY2018: $0.61/litre) in the current quarter; partially offset by
- Higher contribution from OSV and Grab Dredgers due to higher utilisation rate.
Engineering
The breakdown of gross profit and gross profit margin from engineering segment are as follows:
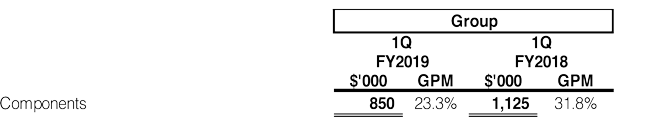
Lower profit margin of 23.3% in 1Q FY2019 was mainly due to lower orders for cutting/coupling systems which generally yielded higher margin. The higher gross profit in 1Q FY2018 included reversal of warranty costs of $138,000.
Other operating income
Details for other operating income are as follows:
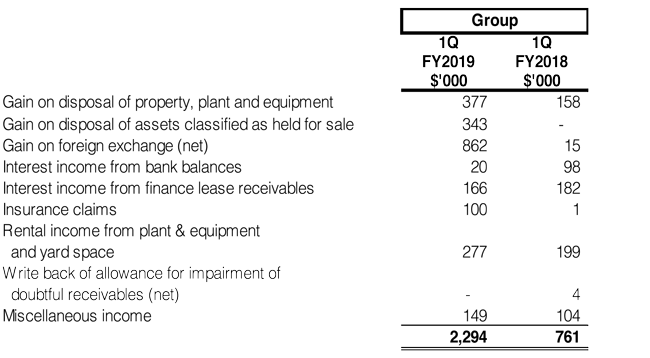
The higher net foreign exchange gain recorded in 1Q FY2019 was mainly due to the depreciation of IDR against SGD on higher IDR denominated liabilities.
Administrative expenses
Administrative expenses decreased by $0.2 million (3.2%) to $5.0 million in 1Q FY2019 when compared to corresponding quarter mainly due to lower staff salaries.
Other operating expenses
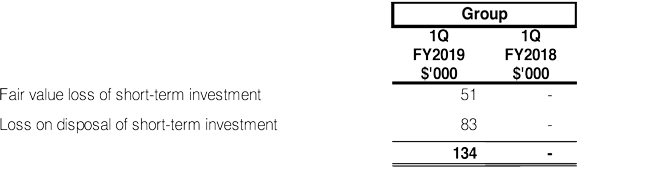
The short-term investment pertains to quoted shares allotted by a customer who is listed on the Singapore Exchange. The new shares subscribed is for settlement of outstanding debts owing by the customer to the Group.
Finance costs
Finance costs increased by $0.2 million (3.5%) to $5.8 million in 1Q FY2019 mainly due to interest incurred from progressive drawdown of loans under the committed $99.9 million 5-year club term loan facility (the “CTL Facility”), partially offset by lower average balances of other bank borrowings.
Share of results of joint ventures and associates
The Group’s share of results of joint ventures and associates comprised:
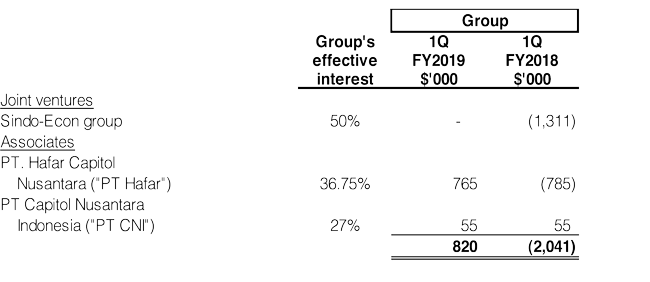
The Group has restricted its share of losses from Sindo-Econ group to its cost of investment since 1Q FY2018.
The share of profit from PT Hafar of $0.8 million in 1Q FY2019 was due to higher charter income from its fleet of OSV vessels during the quarter.
The share of profit from PT CNI of $0.1 million in 1Q FY2019 mainly pertained to progressive recognition of the Group’s proportionate interest of unrealised profits previously eliminated on sale of vessels to PT CNI. The Group has restricted its share of losses to its cost of investment.
Loss before tax
The Group recorded a loss before tax of $6.5 million in 1Q FY2019 mainly due to an overall decrease in gross profit partially offset by higher other income and share of profits of joint ventures and associates.
Tax expense
The Group recorded higher tax expenses of $1.2 million in 1Q FY2019 as compared to the corresponding period. This was mainly due to underprovision of deferred taxes in prior year.
Non-controlling interests
Non-controlling interests’ share of profit of $0.1 million for 1Q FY2019 mainly pertains to the portion of results of its non-wholly owned subsidiaries in Indonesia and China.
Operation cash flow
The Group recorded a lower net cash inflow from operating activities of $11.1 million in 1Q FY2019 (1Q FY2018: $25.4 million) mainly due to lower earnings, lower receipts from shipbuilding progressive billings, higher payment for inventories and higher receivables from customers, partially offset by lower payment to suppliers.
The lower net cash inflow from investing activities of $4.3 million in 1Q FY2019 (1Q FY2018: net cash outflow of $7.6 million) was mainly attributed to lower acquisition of property, plant and equipment and higher proceeds from disposal of property, plant and equipment and assets held for sale.
The higher net cash outflow from financing activities of $17.8 million (1Q FY2018: $10.8 million) was mainly due to higher net repayments on interest-bearing loans and borrowings.
REVIEW OF FINANCIAL POSITION AS AT 30 SEPTEMBER 2018
Non-current assets
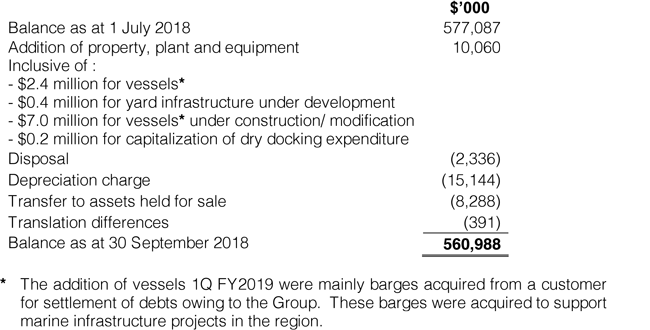
Property, plant and equipment (“PPE”) decreased by $16.1 million (2.8%) from $577.1 million as at 30 June 2018 to $561.0 million as at 30 September 2018.
Movement in PPE during the period under review is as follows:
Current assets
Current assets decreased by $5.4 million (1.2%) from $438.0 million as at 30 June 2018 to $432.6 million as at 30 September 2018. The decrease was mainly from lower contract assets and cash and bank balances, partially offset by higher trade and other receivables.
Inventories decreased marginally and comprised the following:

Trade and other receivables comprised the following:

The trade receivables increased by $10.7 million (13.2%) to $91.9 million mainly due to more shiprepair jobs being completed and billed in the current quarter. Of the total trade receivables, $16.4 million was received subsequent to the quarter under review.
Current liabilities
Current liabilities decreased by $12.2 million (3.7%) from $332.7 million as at 30 June 2018 to $320.5 million as at 30 September 2018. The decrease was mainly due to lower current portion of interest-bearing loans and borrowings as there was a conversion of a short term loan (shipbuilding related) of $12.3 million to a long term vessel loan in the current quarter.
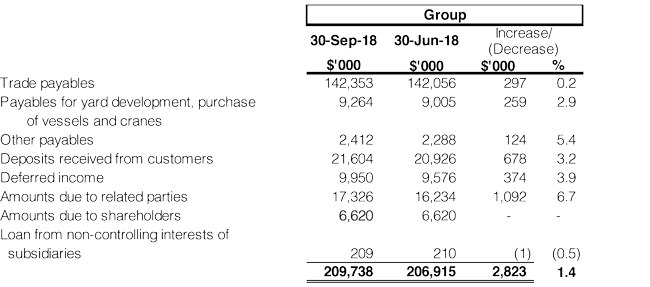
Trade and other payables comprised the following:
Net contract assets decreased by $13.9 million (35.0%) from $39.7 million as at 30 June 2018 to $25.8 million as at 30 September 2018, mainly attributed to completion of shiprepair jobs during the current quarter.
The breakdown of the Group’s total borrowings are as follows:

The Group’s total borrowings decreased by $12.0 million (2.4%) to $490.1 million as at 30 September 2018 mainly due to repayment of interest-bearing loans and borrowings, partially offset by higher trust receipts utilised during the quarter.
Non-current liabilities
Non-current liabilities decreased by $1.4 million (0.3%) to $408.3 million as at 30 September 2018 mainly due to decrease in non-current portion of the Group’s total borrowings due to repayments.
Commentary
Market and industry outlook
As our businesses are primarily reliant on the market conditions in the shipbuilding, shipping, oil & gas and offshore & marine industries, the main macroeconomic variables we are sensitive to include (but not exclusively) global trade, oil prices and infrastructure spending in Asia.
Although the global economic outlook remained healthy, the rising oil prices, higher interest rates in the United States of America and especially the escalating trade tension pose uncertainties in economic growth. In terms of oil prices, the oil majors have decided to extend the curbs on oil supply, and the geopolitical events in Iran, Venezuela and other parts of the world will likely to add uncertainties to the oil price, and in turn to the level of upstream activities. If oil & gas majors increase their capital expenditures across the value chain as forecasted, it could benefit the recovery of the oil services sectors.
Infrastructure spending in select Asian region is expected to increase further, as China implements the Belt and Road Initiative in the countries along the route. The urbanization process in emerging markets such as Philippines and Indonesia should boost spending for vital infrastructure sectors such as water, power and transportation. This represents mid-long term opportunities for the Group’s non-offshore and marine business. In Singapore, as the Tuas Mega Port project gains momentum, the demand for hiring tugs and barges is expected to remain strong.
In general, the factors discussed above suggest an improving business environment for the Group. However, given that capital goods lag the industry cycle and is very sensitive to macro economy, the Group is benefiting from these factors only gradually. We will continue to focus on our core business and strengthen our foothold in supporting marine infrastructure work in Singapore and abroad. We will explore more revenue sources by going beyond our traditional markets (Southeast Asia, Australia and Europe) to North Asia, Indian subcontinent and the Middle East. We will continue to seek cash-flow-positive business opportunities across our business segments and optimize financial performance.
Business segments
Shipbuilding and Shiprepair
In shipbuilding, we will continue to seek orders for non-OSV vessels such as tankers, tugs and barges and exercise caution with selection of customers’ portfolio based on creditworthiness and size of projects.
In shiprepair, with an additional floating dock to be put in place by 3Q FY2019 at the Singapore yard, this will provide additional capacity in terms of servicing the mid-size range of vessels.
We also adopt the strategy to train direct employed workers for specialized work, thus reducing our reliance on subcontractors, and strengthening our competency and efficiency. We will continue to improve operational efficiency, tighten cost control to ensure our competitiveness.
Shipchartering
The diversified vessel types in our fleet, especially the non-OSV vessels are expected to lend support to our chartering business in view of the marine infrastructure projects in Bangladesh, Indonesia, Malaysia and Singapore. Our in-house ability to provide integrated services to modify or retrofit vessels to suit our shipchartering customers’ customized requirements. However, due to market competition, the Group expects continued pressure on charter rates. The management will focus on increasing utilisation of fleet, improving charter rates, limiting capital expenditure and exploring bareboat charter-in of vessels.
The OSV in the market has not recovered from depressed pricing. The Group, however has been actively seeking opportunities to improve the utilisation of the OSV such as deployment for towage jobs.
Dredge Engineering
Our engineering division (VOSTA LMG) engages primarily in the infrastructure and construction industry. Demand for our engineering business is supported by the amount of land and coastal reclamation projects due to population growth and global warming; ii) port expansion projects due to increasing seaborne trade and growing size of container vessels. The Group is working closely with suppliers and seek to have production capability in different regional markets to drive down costs.
Order Book
As at 30 September 2018, the Group had an outstanding shipbuilding order book from external customers of approximately $56 million for the building of 8 vessels with progressive deliveries up to 4Q FY2019. The order book comprises harbour tugs, barges and tanker.
The Group's shipchartering revenue consists of mainly short-term and ad-hoc contracts. Approximately 33% of shipchartering revenue in 1Q FY2019 was attributed to long-term chartering contracts (meaning contracts with a duration of more than one year. As at 30 September 2018, the Group had an outstanding chartering order book of approximately $110 million with respect to long-term contracts.
Investors may wish to note that the financial performance of the companies in the shipping and shipbuilding industries tend to lag industry trends.
Financial Covenant
On 28 June 2018, the Company obtained a waiver for the breach of one of the financial covenants (the “Breach”) under the CTL Facility for the quarter ended 30 June 2018. Accordingly, the Company classified the non-current portion of the CTL Facility as non-current liabilities as at 30 June 2018.
The Company has not obtained a waiver for the similar Breach for the quarter ended 30 September 2018. The Company continues to repay in accordance with the monthly repayment schedule of the Facility Agreement, over the 5-year tenor of the CTL Facility. The Directors are of the view that the Group will receive continuing financial support from the lenders of CTL Facility and the lenders would grant such waiver which the Company will be seeking post the results announcement. In view of the above, the Company has not reclassified the non-current portion of the CTL Facility as current liabilities as at 30 September 2018. In the event that the waiver is not granted, an amount of $85,564,000 would have to be reclassified from non-current liabilities to current liabilities.
The Breach relates to the same covenant that has been clarified in the clarification announcement released via SGXNET on 19 October 2017.